Viewing Spectral Properties
This tutorial covers plotting vibrational spectra, but other types of spectra are possible with the output files from quantum chemical programs
After opening an output file that has been run with the keyword "freq", the "Vibrations" toolbar will automatically open.
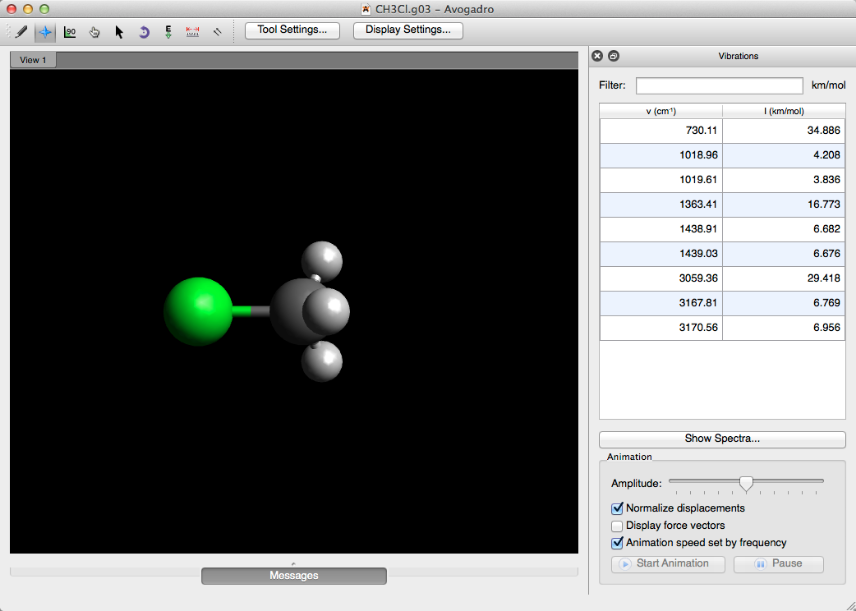
Show Spectra...
Clicking on "Show Spectra..." in the Vibrations toolbar, or selecting "Spectra..." under the "Extensions" menu will open a spectra visualization of the molecule (displayed below).
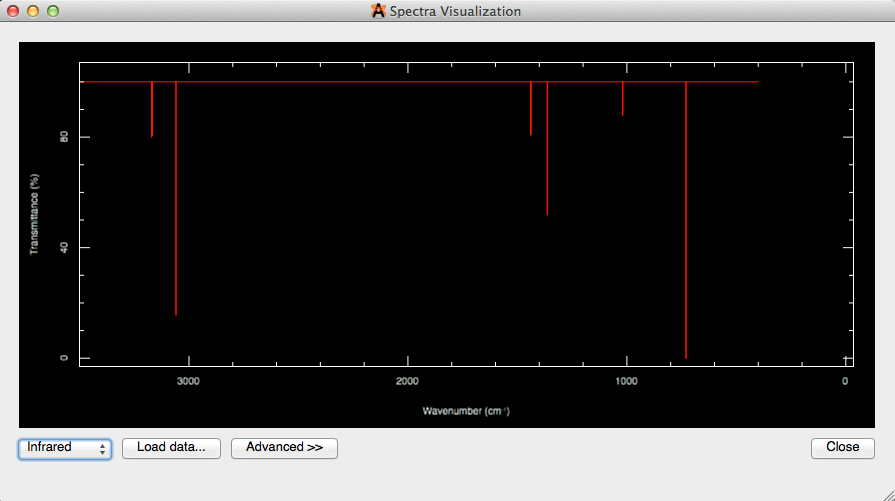
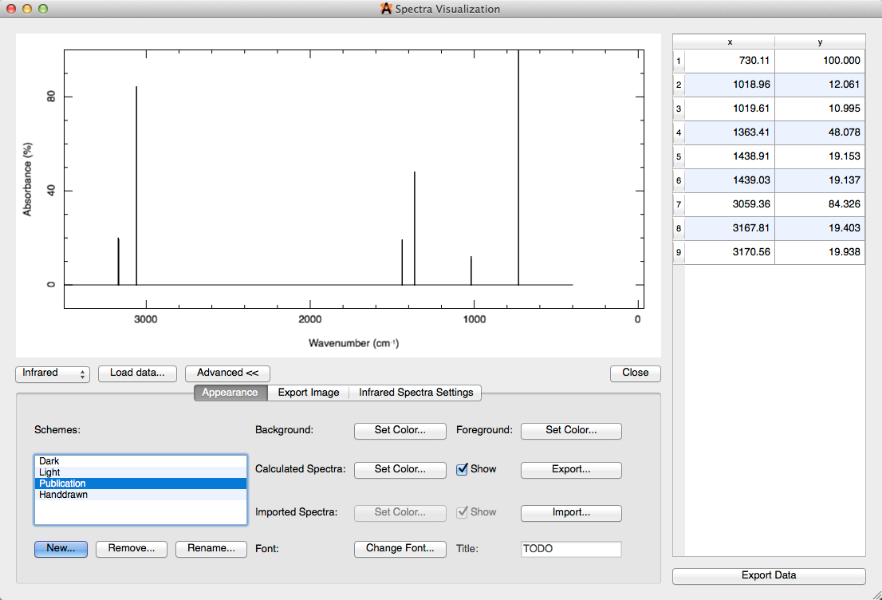
Selecting "Advanced>>" in the spectra visualization will allow you to change the visual settings, as well as the spectral settings, and export the image.
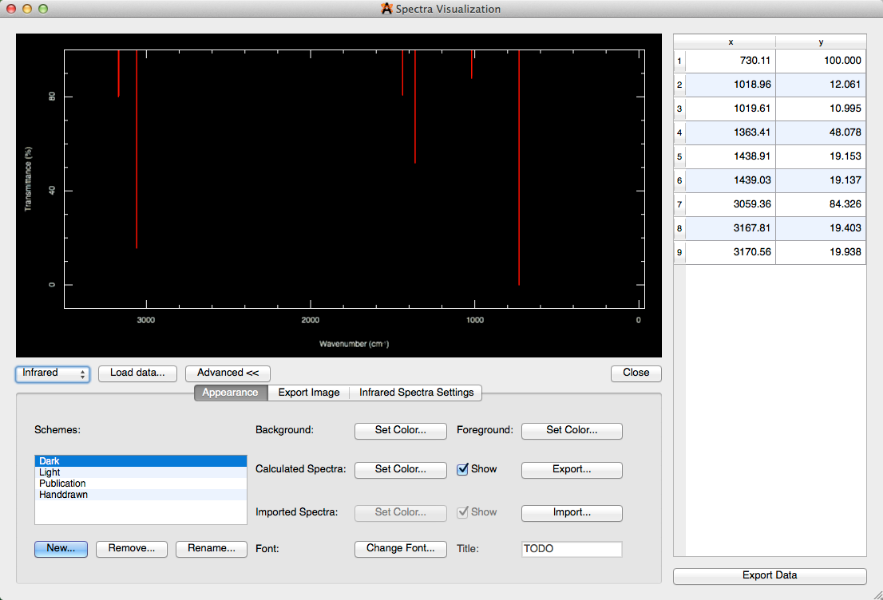
The "Advanced>>" selection provides a multitude of general edits to use at your convenience. For example, you can change % transmittance, to % absorbance (under Infrared Spectra Settings), and change the scheme from dark to publication (Appearance Settings).